
From Complexity to Clarity: Introducing ImpactEd Group's Strategic Impact Dashboards

From Complexity to Clarity: Introducing ImpactEd Group's Strategic Impact Dashboards
It's the week before your next board meeting. You're pulling together data from multiple sources, trying to create a coherent narrative about progress against your trust's strategic priorities. Academic outcomes from one system, safeguarding metrics from another, staff wellbeing data from a spreadsheet that's several months out of date. You want your trustees to have the best possible information, but you're not entirely confident that what you're presenting tells the full story of where you are as an organisation.
Across Multi-Academy Trusts and school groups, senior leaders consistently tell us that preparing for governance meetings is both time-consuming and frustrating. Not because they lack data, but because they're drowning in it without the right tools to make it meaningful.
The governance reporting challenge
The pressures on trust leadership have intensified considerably in recent years. Boards are rightly expecting more sophisticated scrutiny, wanting to understand not just what's happening in their schools but whether it aligns with strategic ambitions. Yet the tools available haven't kept pace. Too often, board packs become unwieldy documents filled with disconnected metrics, lengthy appendices, and data that's relevant to some priorities but not others.
The result? Governance discussions get bogged down in interpreting information rather than making strategic decisions. Trustees struggle to see the wood for the trees and see how data aligns with objectives and outcomes. Executive teams spend valuable time on data compilation rather than data interpretation. And critically, there's often no consistent way to track progress over time or understand performance in meaningful context.
A different approach to strategic oversight
That's why we've developed Strategic Impact Dashboards. A consultancy-led approach that transforms how trusts understand and drive their strategic priorities. And while the output of this work is a dashboard to track strategy over time, the input is a valuable board and executive guided process to refine approach, priorities and metrics..
Our work begins with facilitated workshops where we work alongside your leadership team to identify the KPIs that genuinely reflect your strategic ambitions. Not what's easiest to measure, but what matters most to your trust's unique context and goals. This might include academic outcomes, certainly, but also staff engagement, community impact, organisational sustainability, and the broader measures of success that define your vision for the young people and communities you serve.
Only once we've established this strategic clarity do we build your dashboard. The result is a board-ready reporting tool that provides trustees and executives with a single source of truth, where every metric ties directly to your strategic priorities and is tracked consistently over time.
Making data work harder for governance
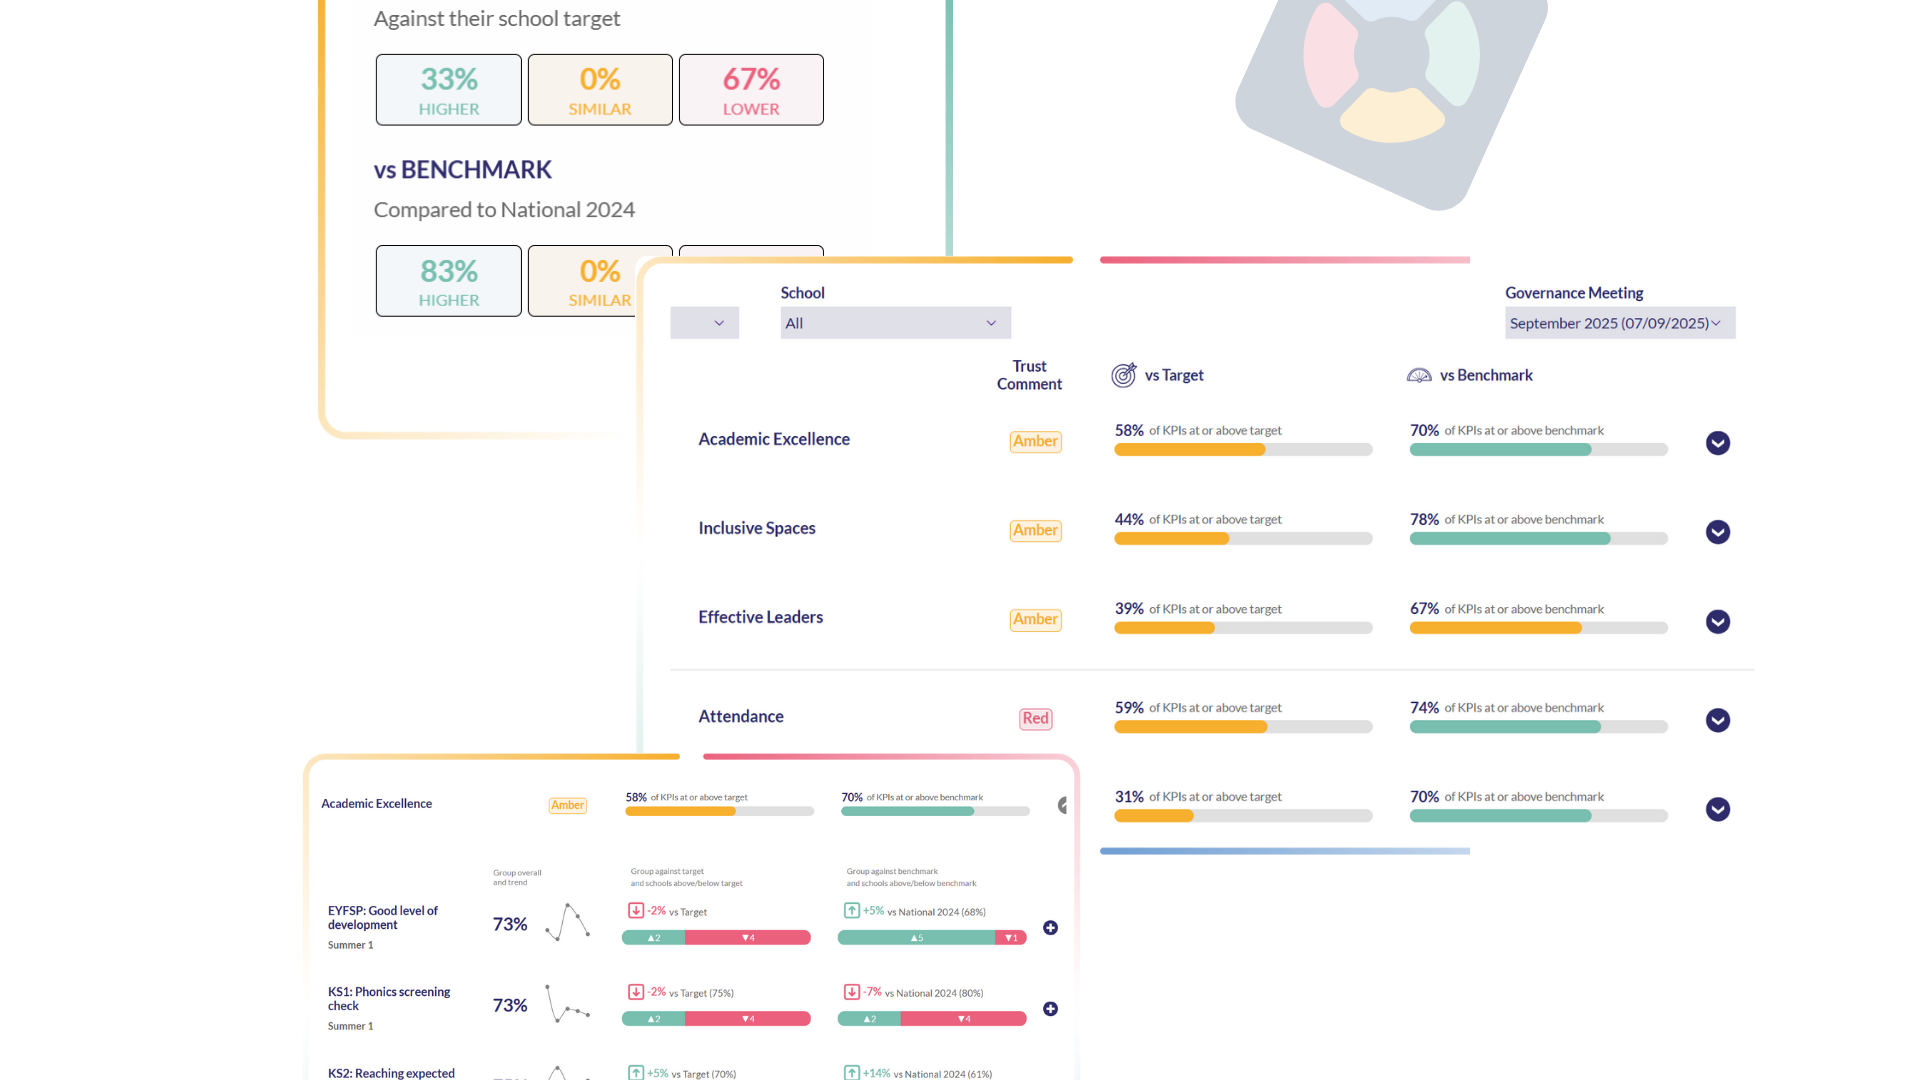
The dashboards themselves combine rigorous methodology with intuitive functionality. At the highest level, trustees see curated strategic priorities with four-point RAG ratings(deliberately avoiding the comfort of amber-neutral territory), relevant benchmarks, and clear targets. From there, they can drill down seamlessly from trust-wide trends to individual school performance, navigating from strategic overview to granular detail when scrutiny demands it.
Crucially, this isn't just a data visualisation exercise. Built-in approval processes ensure that no information enters the dashboard without explicit sign-off from senior leadership. Commentary prompts mean every data point has an owner and a narrative. The combination of quantitative metrics and qualitative insight creates a holistic picture that supports genuine strategic conversation rather than surface-level reporting.
Partnership, not just a platform
Perhaps most importantly, Strategic Impact Dashboards aren't a one-time build. Your strategic priorities will evolve, the education landscape will shift, and what you need to measure will change accordingly. That's why our model includes ongoing advisory support to ensure your dashboard continues to reflect what matters as your organisation grows and develops.
This is fundamentally about enabling more effective governance. When boards and executive teams have clarity about progress, can track trends over time, and can benchmark meaningfully against relevant comparators, the quality of strategic decision-making improves dramatically. Time previously spent deciphering data gets redirected toward the conversations that actually drive improvement.
Transform your governance reporting
If you are ready to align your reporting more tightly with your strategic ambitions, we'd welcome the opportunity to discuss how Strategic Impact Dashboards might support your work.
Contact Holly Waddell to learn more, or contact us to book a demo and explore what strategic clarity could look like for your trust.
Get in touch
To speak to one of our senior team about how we could support your work, please get in touch
